
What if your broker’s “fast” fills are quietly costing you money?
Execution metrics—price improvement, slippage (implementation shortfall), fill rate, latency, and benchmark deviation—reveal whether your broker is capturing value or bleeding it on every trade.
This post shows the exact tests to run, which benchmarks to use (NBBO midpoint, VWAP, arrival price), and how to run basic transaction cost analysis to spot bad routing or pay-for-flow setups.
By the end you’ll know which numbers matter and when to act.
Core Methods to Evaluate Brokerage Execution Quality Metrics

Execution metrics tell you whether your broker’s actually capturing value or quietly bleeding money on every fill. Measure price improvement, slippage, fill rates, latency, and benchmark deviation together and you’ll spot patterns that any single number misses. A broker delivering tight spreads but slow fills might be gaming one stat while costing you opportunity. A broker promising fast fills but routing to dark pools with worse prices? Trading speed for pricing power.
Every metric needs a reference. Price improvement measures how many cents per share you saved versus the National Best Bid and Offer (NBBO) at execution time. Slippage (also called implementation shortfall) captures the gap between the price when you decided to trade and the price you got, including market movement and execution delay. Fill rate tracks what percentage of your order quantity actually executed. Execution latency measures milliseconds between order submission and confirmation. Benchmark deviation compares your fill to the Volume-Weighted Average Price (VWAP) or Time-Weighted Average Price (TWAP) over your trading window, or to the NBBO midpoint.
Unweighted averages treat every trade the same, so a 100 share order counts as much as a 10,000 share order. Volume-weighted averages multiply each trade’s metric by size, showing whether bigger orders pay more. In one large portfolio trading study, average bid/offer spread captured (BOS) hit 43 percent unweighted but only 35 percent volume-weighted. Bigger trades paid slightly more relative to the spread. An insight that disappears if you only look at simple means.
Five key metrics every trader must evaluate:
- Price improvement (dollars or basis points better than NBBO)
- Slippage / implementation shortfall (arrival price vs executed price)
- Fill rate (percentage of quantity filled vs quantity ordered)
- Execution latency (order to fill time in milliseconds)
- Benchmark deviation (distance from VWAP, TWAP, or NBBO midpoint in basis points)
Benchmarking Trade Execution Against Market Reference Prices and Slippage Impact

Benchmarking ties your execution to an objective standard so you can separate broker skill from market noise. The NBBO midpoint (halfway between the best bid and best offer at execution time) is the cleanest single point reference because it represents fair price absent urgency or size. VWAP averages all market trades weighted by volume over a chosen period. Comparing your fill to VWAP tells you whether you did better or worse than the crowd. TWAP averages prices at regular intervals regardless of volume, useful when time’s the constraint. Arrival price is the market price the moment you decided to trade, before your order touched the market. Deviation from any benchmark, measured in basis points or cents, quantifies your execution cost relative to what was theoretically available.
Implementation shortfall combines slippage and market impact into one number. If you decided to buy at 50.00 (arrival price) but filled at 50.08, your shortfall is 8 cents or 16 basis points. That 8 cents includes the spread you crossed, market movement while your order was working, and any price impact your size created. Larger notionals push prices further because liquidity providers demand compensation for risk. In portfolio trading, volume weighted BOS dropped from 43 percent to 35 percent as trade size increased. A direct measure of size driven market impact. When 44 percent of items executed better than midpoint and 73 percent landed within 2 basis points, those percentages become the benchmarks for acceptable deviation. Anything worse signals a problem with routing, timing, or liquidity selection.
| Benchmark | What It Measures | Why It Matters |
|---|---|---|
| NBBO Midpoint | Fair price at execution instant | Isolates spread capture from market movement |
| VWAP | Volume-weighted market average | Shows whether you traded better or worse than aggregate market participants |
| Arrival Price | Market price at decision time | Captures total slippage including delay and impact |
Measuring Price Improvement, Effective Spread, and Realized Spread (Deep Dive)

Price improvement is any execution inside the NBBO spread. If the best bid’s 50.00 and the best offer’s 50.10, buying at 50.06 delivers 4 cents of improvement versus paying the full offer. Effective spread measures what you actually paid relative to midpoint, doubling the distance to express cost in spread terms. So a 3 cent distance from mid equals a 6 cent effective spread. Realized spread subtracts post-trade price movement to isolate the dealer’s profit from the adverse selection cost you created by trading on information.
Bid/offer spread captured (BOS) normalizes execution on a 0 to 50 percent scale where paying the full spread equals 0 percent and trading at midpoint equals 50 percent. Anything above 50 percent means you executed inside the midpoint, on the favorable side. In recent data, portfolio traders achieved roughly 40 to 45 percent BOS, up from about 30 percent in 2022. Better routing and tighter spreads as electronic liquidity improved. That 10 to 15 point rise is the difference between consistently paying near the offer and consistently landing closer to mid.
Spread outcomes vary by liquidity. In highly liquid names with tight 1 to 2 cent spreads, capturing 40 percent might save only a fraction of a basis point per share. But across thousands of shares it compounds. In wider, less liquid spreads of 20 to 50 cents, capturing 40 percent can mean multiple basis points saved per trade. When you measure BOS or effective spread, always segment by symbol liquidity score or average daily volume to understand where your broker’s adding value and where execution’s slipping.
Understanding Execution Speed, Latency, and Time to Fill Metrics

Execution latency is the clock time from order submission to fill confirmation. Typically measured in milliseconds for electronic orders or seconds for manual workflows. Latency matters because prices move. A 200 millisecond delay in a volatile stock can mean the difference between getting filled at your decision price and chasing the market 5 cents higher. In one portfolio study, median execution latency was 120 milliseconds. Fast enough to limit slippage. When median latency exceeds 200 milliseconds for market orders, investigate whether the broker’s routing infrastructure is outdated or whether your orders are queuing behind others.
Time to fill extends latency to include partial fill scenarios. If you submit a 10,000 share order and receive 5,000 shares immediately and the rest 30 seconds later, time to fill for the full quantity is 30 seconds even though first fill latency was instant. Time to fill correlates with execution certainty. In the same portfolio study, a 95 percent hit rate (meaning 95 percent of requested volume actually traded) showed that nearly all orders filled completely with minimal delays, even in thinly traded securities. Low hit rates or long time to fill signal weak routing or unrealistic limit prices.
Latency factors to monitor:
- Network and FIX protocol transmission delay between your system and the broker’s order management system
- Broker internal queue time before the order routes to an exchange or dark pool
- Venue matching engine speed, which varies by exchange and can add 5 to 50 milliseconds
- Timestamp accuracy in broker confirmations. Compare order entry, routing, and execution timestamps to catch discrepancies that hide true latency
Order Routing Transparency and Broker Best Execution Disclosures
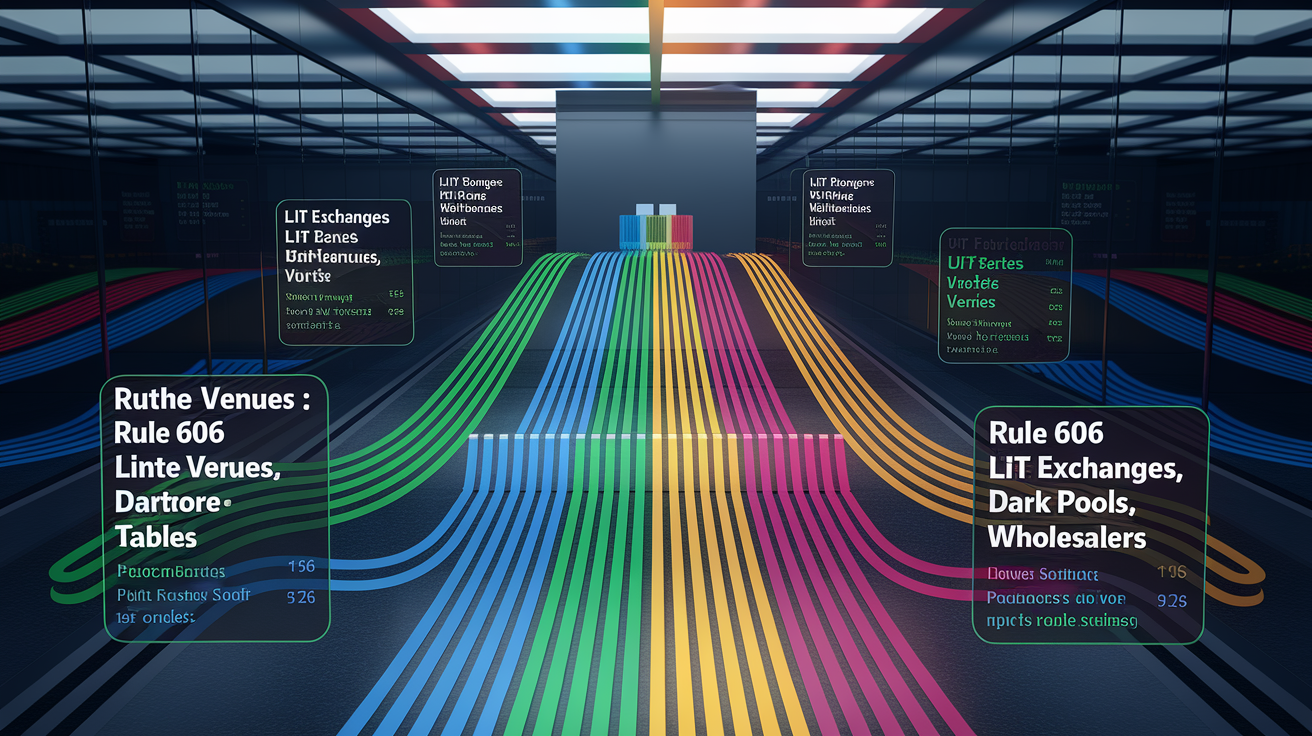
Brokers must disclose where they route your orders and what compensation they receive under SEC Rule 606. Rule 606 reports show the percentage of orders sent to each venue (exchange, dark pool, or wholesaler) and any payment for order flow. If 80 percent of your market orders route to a single wholesaler and that wholesaler pays the broker for the flow, compare execution quality on those orders to orders routed to lit exchanges. Worse prices on internalized orders are a red flag that the broker’s prioritizing rebates over your outcome.
Routing inconsistencies reveal hidden practices. If the broker’s public best execution policy says “we prioritize price improvement” but the 606 report shows heavy internalization to venues with the lowest reported price improvement rates, the policy and practice conflict. Compare the broker’s aggregated price improvement percentage in their disclosures to your own transaction cost analysis. A 3 point gap suggests the broker’s quoting firm wide statistics that don’t match your account’s reality. Often because retail orders receive better treatment than institutional flow.
Venue concentration is another signal. If one dark pool handles 60 percent of your volume but shows higher effective spreads than the other 40 percent routed to exchanges, the broker’s steering flow for reasons unrelated to execution quality. Liquidity rebates, internalization agreements, or order flow arrangements. Request a breakdown of execution metrics by venue and compare. Best execution is a requirement, not a courtesy, and the data to verify it must come from the broker on demand under Rule 606 and supplemental reporting.
Using Transaction Cost Analysis (TCA) and Post Trade Analytics

Transaction cost analysis starts with raw data: order tickets, fill confirmations, timestamps, execution venues, quantities, and prices. Pull at least 1,000 trades over a 30 to 90 day window to stabilize means and percentiles. Fewer than 1,000 trades leave your statistics vulnerable to outliers. A single bad fill can skew a 50 trade sample by several basis points. Three months smooths weekly volatility and seasonal effects while staying recent enough to reflect current broker behavior.
Reconstruct the market state at each execution timestamp. For every fill, capture the NBBO bid, offer, and midpoint, plus the VWAP over your execution window if you traded in pieces. Many brokers provide NBBO snapshots in trade confirmations. If not, subscribe to historical tick data or request time and sales logs from your market data provider. Align your fill price to the NBBO at fill time, not order time, because latency between decision and execution introduces market movement that isn’t the broker’s fault. Compute slippage as fill price minus arrival price, price improvement as NBBO offer minus fill price (for buys), and benchmark deviation as fill price minus VWAP or midpoint.
Five step TCA workflow:
- Collect fill confirmations, order timestamps, execution timestamps, quantities, prices, and venue IDs for every trade in the sample period
- Align each trade to the NBBO bid/offer and midpoint at the exact execution timestamp using tick data or broker provided snapshots
- Reconstruct VWAP over the window each order was working, or use arrival price as the decision benchmark
- Compute per trade metrics (basis point slippage, price improvement dollars, latency milliseconds, fill percentage) and flag any missing or inconsistent data
- Aggregate by symbol, venue, order type, and broker using mean, median, and 90th percentile statistics, then compare distributions to detect outliers and systematic patterns
Outliers matter as much as averages. A broker with a 5 basis point median slippage but a 90th percentile slippage of 25 basis points has a consistency problem. Sort trades by slippage and investigate the worst 10 percent. Common causes include stale limit prices, poor venue selection during volatile periods, or routing to low liquidity pools. Use confidence intervals or bootstrapping to understand whether differences between two brokers are statistically significant or just sample noise. A 2 basis point gap on 1,000 trades is real, but the same gap on 50 trades might be luck.
Evaluating Broker Performance Through Portfolio Construction Insights

Comparing brokers requires controlling for what you traded, not just how the broker executed it. A broker who handles small, liquid orders will always show tighter spreads than one who handles large, illiquid blocks. Adjust for portfolio attributes (total notional, weighted average liquidity score, number of unique line items, sector diversity, and maturity or duration spread) before concluding that one broker’s better. In a controlled study of thousands of portfolio trades, smaller line item size, higher liquidity scores, and greater sector diversity all improved execution quality after adjusting for other factors.
Liquidity drives cost. A portfolio with a weighted average liquidity score above 7 (on a 1 to 10 scale) and more than 70 percent overlap with a reference ETF like LQD or HYG achieved execution roughly 0.4 basis points better than midpoint. By contrast, optimizing only one variable (say, keeping line size below 50,000 dollars) delivered just 0.1 basis point of improvement. The interaction of liquidity, size, and hedgeability (ETF overlap) explains far more variance in execution outcomes than any single factor. When you evaluate brokers, segment results by these portfolio characteristics and compare within each segment.
Sector diversity also affects execution. Portfolios with more unique sectors showed higher BOS after controlling for notional, liquidity, and number of line items. Likely because sector diverse portfolios attract more competitive dealer quotes and reduce concentration risk for liquidity providers. This finding flips conventional wisdom that narrow sector bets are easier to execute. In practice, dealers price concentration risk into their spreads, and a well diversified portfolio (even with the same total notional) costs less to trade. Use this insight when you construct RFQs: break large single sector blocks into smaller cross sector lists when possible.
Key Portfolio Drivers
Line item size and liquidity interact. A 100,000 dollar line in a highly liquid bond may execute near mid, but the same size in an illiquid name pays 10 to 20 basis points more. Spread small notional across more line items rather than concentrating size in fewer names. In the portfolio study, larger notionals consistently showed worse volume weighted BOS (35 percent) than smaller trades (43 percent unweighted). Size costs money even when liquidity’s good. ETF overlap hedgeability also matters. Bonds that are constituents of LQD or HYG trade cheaper because dealers can hedge the risk in the ETF. When building a portfolio RFQ, calculate overlap percentage and aim for at least 50 percent. Anything above 70 percent meaningfully lowers execution cost.
Tools, Dashboards, and Real Time Monitoring of Execution Quality

Weekly dashboards turn TCA from a post mortem into a live feedback loop. Display the past week’s median slippage, fill rate, latency, and price improvement rate on a single screen, segmented by broker, symbol, and order type. Update every Monday morning so traders and portfolio managers see last week’s performance before the new week starts. Monthly summaries add statistical confidence and trend lines. Quarterly reviews tie execution quality to broader data reconciliation audits, catching ingestion errors that appear at least once per quarter and corrupt the underlying fill data.
Real time alerts catch problems while you can still act. Set thresholds (median latency above 200 milliseconds, slippage above 10 basis points on any single fill, or fill rate below 98 percent for market orders) and route alerts to the trading desk and broker relationship manager. Alerts work best when they reference rolling 24 hour windows, not daily buckets, because execution quality can degrade intraday during volatile sessions. Pair alerts with automated broker scorecards that rank execution metrics across all brokers you use, so switching flow becomes a data driven decision instead of a relationship call.
Alert types to configure:
- Latency spike: any order with execution time greater than 2× the broker’s 30 day median
- Slippage outlier: fill price more than 10 basis points worse than VWAP during the execution window
- Venue routing anomaly: sudden shift in routing percentages (e.g., 40 point drop in exchange routing in one day) without explanation
Common Execution Quality Red Flags and How to Identify Them
Systematic negative price improvement means you consistently pay more than midpoint even on small, liquid orders. If 90 percent of your fills land on the wrong side of mid, the broker’s either routing to low quality venues or internalizing your flow at worse prices. Check the broker’s Rule 606 report for payment for order flow disclosures and compare price improvement rates by venue. Negative price improvement on marketable orders in tight spreads is the clearest sign that routing prioritizes rebates over execution.
Large slippage dispersion (when the gap between your 10th percentile and 90th percentile slippage exceeds 20 basis points) indicates inconsistent execution. A few terrible fills drag down your average, and those fills cluster around specific symbols, times, or venues. Sort your worst 10 percent of trades and look for patterns: are they all in the same sector, all routed to the same dark pool, or all executed during the last 30 minutes of the trading day? Concentrated poor execution reveals process failures, not random bad luck.
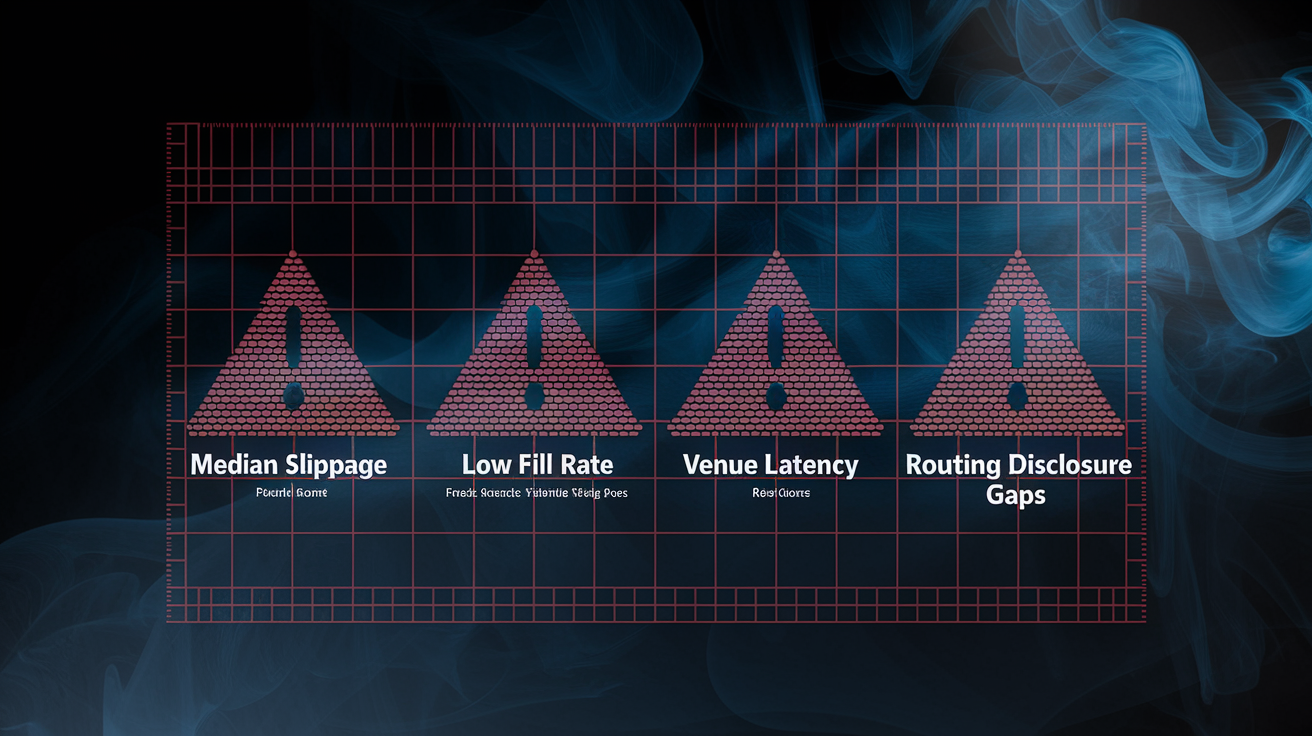
Four red flags that warrant immediate escalation:
- Median slippage greater than 10 basis points for liquid equities or bonds, sustained over 30 days
- Fill rate below 98 percent for marketable orders without clear explanations (limit price constraints, halted symbols)
- Venue specific latency: one routing destination consistently shows 3× the latency of others
- Routing disclosure gaps: broker’s monthly report omits primary execution venues or provides only aggregated statistics without symbol level breakdowns
Venue specific latency issues point to infrastructure problems. If your broker routes 50 percent of orders to Exchange A with 80 millisecond median latency and 50 percent to Exchange B with 250 millisecond latency, ask why orders still go to B. The answer’s often rebates or internalization agreements, not best execution. Routing disclosures that omit venues or lump “other” into a 20 percent category hide where your orders actually go, making it impossible to verify execution quality by destination. Demand venue level detail and compare it to your own TCA by parsing venue codes in your fill confirmations.
Final Words
In the action, this guide walked through the core metrics—price improvement, slippage, fill rate, latency—and how to benchmark those against NBBO, midpoint, VWAP, and arrival price. It also covered TCA workflows, routing transparency, portfolio adjustments, dashboards, and common red flags.
Use a repeatable TCA, check weekly dashboards, and compare volume-weighted and unweighted results to spot patterns. If you want to know how to assess brokerage trade execution quality, start with a 1,000-trade sample and simple benchmarks.
You’ll catch issues early and make smarter routing choices.
FAQ
Q: What core metrics should I use to evaluate brokerage execution quality?
A: Core metrics to evaluate brokerage execution quality are price improvement, slippage (implementation shortfall), fill rate, execution latency, and deviation versus NBBO, midpoint, or VWAP, giving a full pricing-efficiency picture.
Q: What are sensible threshold values for slippage, price improvement, and fill rate?
A: Sensible thresholds are: average slippage above about 10 basis points is concerning, price improvement under roughly 5–10% is a red flag, and fill rates below 98% for marketable orders indicate problems.
Q: How does BOS (bid/offer spread captured) work and what numbers matter?
A: BOS measures spread capture where mid equals 50% BOS; BOS above 50% beats midpoint. Typical recent BOS runs ~40–45% overall; watch for less than ~30% as weak routing.
Q: When should I benchmark to NBBO, midpoint, VWAP, or arrival price?
A: You should benchmark to NBBO, midpoint, VWAP, or arrival price depending on the trade goal: NBBO/midpoint for best-price checks, VWAP/TWAP for time-weighted performance, and arrival price for implementation shortfall analysis.
Q: How do trade size and liquidity affect benchmarking and slippage?
A: Trade size and liquidity affect benchmarking by increasing market impact: larger notionals typically trade further from best levels, yielding worse volume-weighted BOS (around 35%) and larger implementation shortfalls.
Q: What is a practical TCA sample size and workflow?
A: A practical TCA uses at least 1,000 trades over 30–90 days, with steps: collect data, align timestamps, reconstruct benchmarks (NBBO/VWAP), compute slippage/price improvement, then aggregate and inspect distributions and outliers.
Q: What latency and time-to-fill numbers should I watch for?
A: You should watch median execution latency around 120 milliseconds as typical; problems appear when median exceeds ~200 ms. Also track time-to-fill and a high hit rate (example: 95%) for execution certainty.
Q: How do I spot routing transparency issues or hidden internalization?
A: You spot routing issues by reviewing Rule 606 reports, checking concentrated venue percentages, inconsistent routing patterns, and mismatches between routing disclosures and actual execution metrics like fill rate and price improvement.
Q: What red flags indicate poor execution quality?
A: Red flags for poor execution quality include systematic negative price improvement, large slippage dispersion across similar trades, venue-specific latency spikes, and fill rates or BOS consistently worse than peers or benchmarks.
Q: How should I use volume-weighted versus unweighted metrics?
A: You should use both: unweighted metrics show per-trade fairness, while volume-weighted metrics reveal cost on dollar exposure—together they show whether larger trades suffer disproportionate slippage or worse BOS.
Q: What monitoring and alerting practices are recommended for ongoing execution oversight?
A: Recommended monitoring includes weekly dashboards, plus alerts for latency spikes, slippage outliers, and venue-routing anomalies; reconcile trades regularly, since reconciliation issues commonly appear at least quarterly.
