
Did you know a 0.65% expense ratio can cost you tens of thousands over 30 years on a modest investment?
Fees aren’t fine print.
They’re performance killers.
Expense ratio (the yearly percentage taken from your fund).
Load fees are one-time sales charges.
You won’t see these as bills, but they shrink the money actually working for you.
This guide shows how to find fees, convert them into dollars, compare similar funds, and spot the real catch.
By the end you’ll know when a higher fee might be worth it and when to walk away.
Core Steps to Evaluate Mutual Fund Expense Ratios and Load Fees

An expense ratio is the annual percentage taken from your mutual fund to cover operating costs. Management, administration, marketing, other expenses. Load fees are one-time sales charges you pay when buying or selling shares. Both reduce the money working for you, and they compound over time. Understanding and comparing these costs matters before you invest a dollar.
Expense ratios get deducted daily from the fund’s net asset value. You won’t see a separate bill. A 1.00% expense ratio means you’re paying $10 per year for every $1,000 invested. Invest $10,000 with a 0.75% expense ratio? You’re paying $75 that year. Load fees work differently. A 5% front-end load on a $10,000 purchase means $500 goes to the broker or distributor, leaving just $9,500 actually invested. Those fees don’t show up on your account statement as line items, but they reduce your investment balance or returns from day one.
Comparing fees matters because small differences compound. Over decades, a fund charging 0.65% can cost tens of thousands more than an identical fund charging 0.05%. Add a 5% front-end load and you start behind. The decision becomes simple: if two funds track the same index, the one with lower fees wins. If an active fund charges more, it has to beat the market by at least the fee difference every single year just to break even with a cheaper alternative.
How to evaluate expense ratios and load fees:
-
Locate the fees in the prospectus or fund fact sheet. Open the “Fees and Expenses” table. The expense ratio will be listed as a percentage. Front-end loads, back-end loads, and 12b-1 fees get itemized separately.
-
Convert basis points to percentages. If a fund lists 65 basis points, divide by 100: that’s 0.65%. See 3 basis points? That’s 0.03%.
-
Calculate the annual dollar cost. Multiply the expense ratio by your investment amount. Example: 0.65% × $10,000 = $65 per year.
-
Compare the fund to category averages and competitors. Equity index funds average around 0.05%. Actively managed funds average around 0.65%. Bond funds around 0.37%. If your fund is above the average, ask why.
-
Factor in loads when projecting net returns. Subtract the front-end load from your initial investment to find the amount actually invested. For back-end loads, check the redemption schedule and subtract the applicable percentage from your sale proceeds based on how long you held the fund.
Breaking Down Mutual Fund Expense Ratios and Their Components

The expense ratio is just the fund’s total annual operating costs divided by average assets under management. If a fund has $10 million in assets and $100,000 in operating expenses, the expense ratio is $100,000 ÷ $10,000,000 = 1.00%. That 1.00% gets deducted incrementally, usually daily, so each day’s return reflects the net performance after fees. Investors receive no invoice. The fees just reduce the fund’s net asset value.
Every expense ratio is a mix of several components. The breakdown tells you where your money goes. Management fees typically make up the largest share, followed by administrative and distribution costs. Understanding each piece helps you spot whether a fund is charging for genuine value or padding margins.
Detailed Expense Categories
Management fees cover portfolio manager salaries, research, analyst teams, and the cost of executing trades. Actively managed funds pay higher management fees than index funds because active managers require research infrastructure.
Administrative expenses include record-keeping, accounting, legal compliance, custodial services, and regulatory filings. These are usually a smaller slice of the total expense ratio but still necessary for day-to-day operations.
Distribution and 12b-1 fees pay for marketing, advertising, broker commissions, and shareholder services. These fees can range from 0.25% in no-load funds to 1.00% in some share classes. They reduce returns every year and are sometimes used to compensate brokers for selling the fund.
Interest and borrowing costs appear when a fund uses leverage or borrows to cover redemptions. This component is often zero or minor in most mutual funds but can appear in leveraged or alternative funds.
Tax costs come from taxes on capital gains, dividends, or interest that the fund incurs. These are less common in U.S. mutual funds but can appear in international or offshore funds. They reduce the fund’s net returns before distributions.
Understanding Mutual Fund Load Fees and Fee Structures
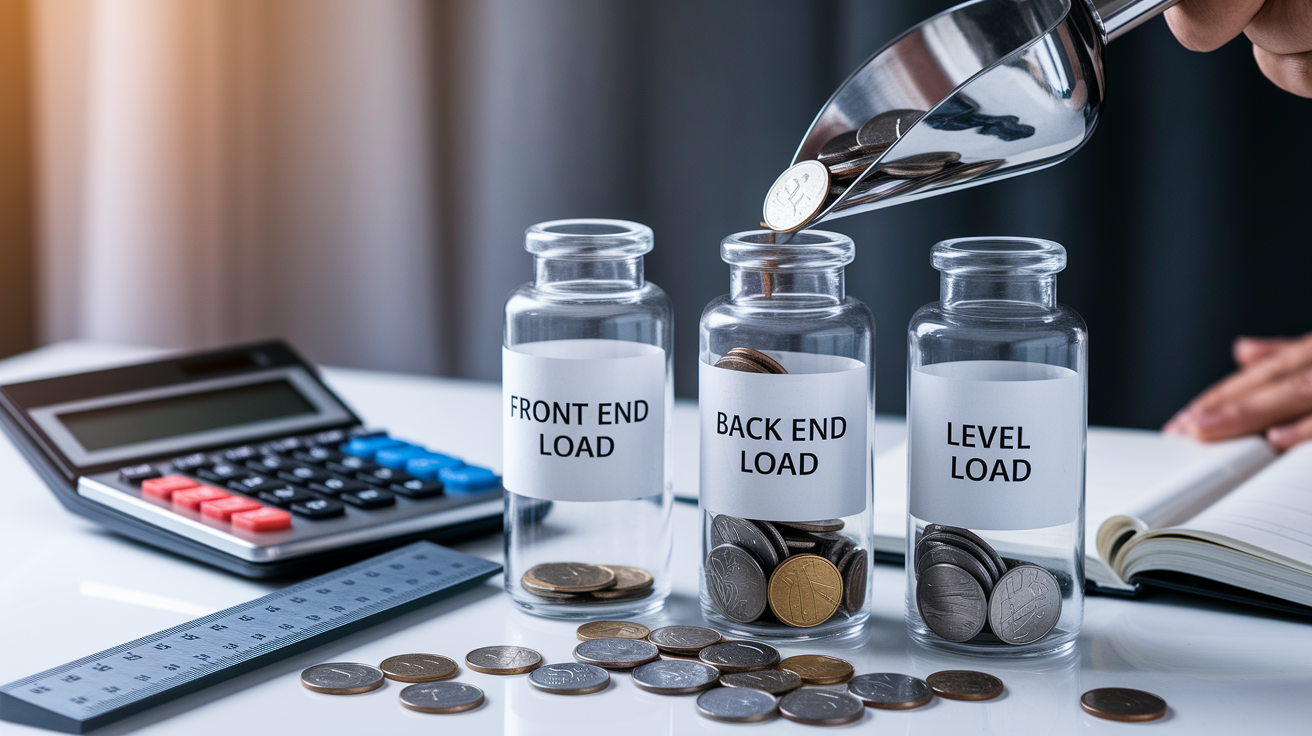
Load fees are sales charges paid to brokers or financial advisors for recommending or selling the fund. They come in three main forms: front-end, back-end, and level loads. Front-end loads are charged when you buy shares. Back-end loads (also called contingent deferred sales charges or CDSC) are charged when you sell. Level loads are ongoing fees embedded in the expense ratio.
A front-end load of 5% on a $10,000 purchase means you pay $500 up front and only $9,500 actually goes into the fund. That’s a permanent hole in your invested capital. Back-end loads usually decline over time, commonly 5% in year one, 4% in year two, and so on until they disappear after five to eight years. If you redeem $10,000 in year one with a 5% CDSC, you lose $500 at sale. Level loads are 12b-1 fees that act like a slow-motion load, reducing your returns each year indefinitely.
Load mechanics and timing impact:
Front-end loads reduce your initial investment immediately. Example: 5.75% load on $50,000 = $2,875 paid, $47,125 invested. Your break-even starts 5.75% behind a no-load alternative.
Back-end loads (CDSC) apply when you sell and usually decline each year. Example: 5% CDSC in year 1, then 4%, 3%, 2%, 1%, zero by year 6. Holding the fund long enough avoids the charge, but you’re locked in.
Level loads are annual 12b-1 fees that typically add 0.25% to 1.00% to the expense ratio. Over a decade, a 0.50% level load on $10,000 costs roughly $500 to $600 after compounding, similar to a small front-end load but stretched out.
How to Locate Expense Ratio and Load Information in Fund Documents

All mutual funds are legally required to disclose fees in the prospectus and annual reports, so the information exists. You just need to know where to look. The fastest route is the Summary Prospectus or the fund’s fact sheet, both of which contain a “Fees and Expenses” table near the front. That table lists the expense ratio, front-end and back-end loads, redemption fees, and 12b-1 fees in a standardized format.
Can’t find a fact sheet? Go to the fund company’s website and search for the fund’s ticker or name. Most fund pages display the expense ratio and share-class details prominently. You can also check your brokerage or retirement-plan website, which often lists expense ratios and loads in the fund’s profile. If you’re evaluating older or less common funds, the full prospectus and Statement of Additional Information are available on the SEC’s EDGAR database at sec.gov. Search by fund name or ticker to pull official filings.
Always verify the share class you’re evaluating. Class A shares typically carry front-end loads and lower annual fees. Class B and C shares use back-end or level loads with higher ongoing fees. Institutional or I shares often have the lowest expense ratios but require minimum investments or access through employer plans. Mixing up share classes will give you the wrong cost comparison.
Document review to find all fees:
-
Open the Summary Prospectus or fund fact sheet. Look for the “Fees and Expenses” or “Shareholder Fees” table within the first few pages. Note the expense ratio, any front-end or back-end load percentages, and 12b-1 fees.
-
Check the share class. Confirm whether you’re reviewing Class A, B, C, or I shares. Each class has different fee structures. The ticker symbol or fund name will indicate the share class (e.g., ABCAX for Class A, ABCIX for Class I).
-
Review the annual report for actual past expenses. The prospectus shows the maximum or estimated fees. The annual report shows what the fund actually charged last year. Check for fee waivers or reimbursements that may expire.
-
Verify the filing date and use SEC EDGAR if needed. Make sure the prospectus is current. If the document is older than a year or you need additional detail, search SEC EDGAR for the most recent N-1A filing (the official prospectus form) or the annual report (N-CSR filing).
Calculating the Dollar Impact of Expense Ratios and Load Fees
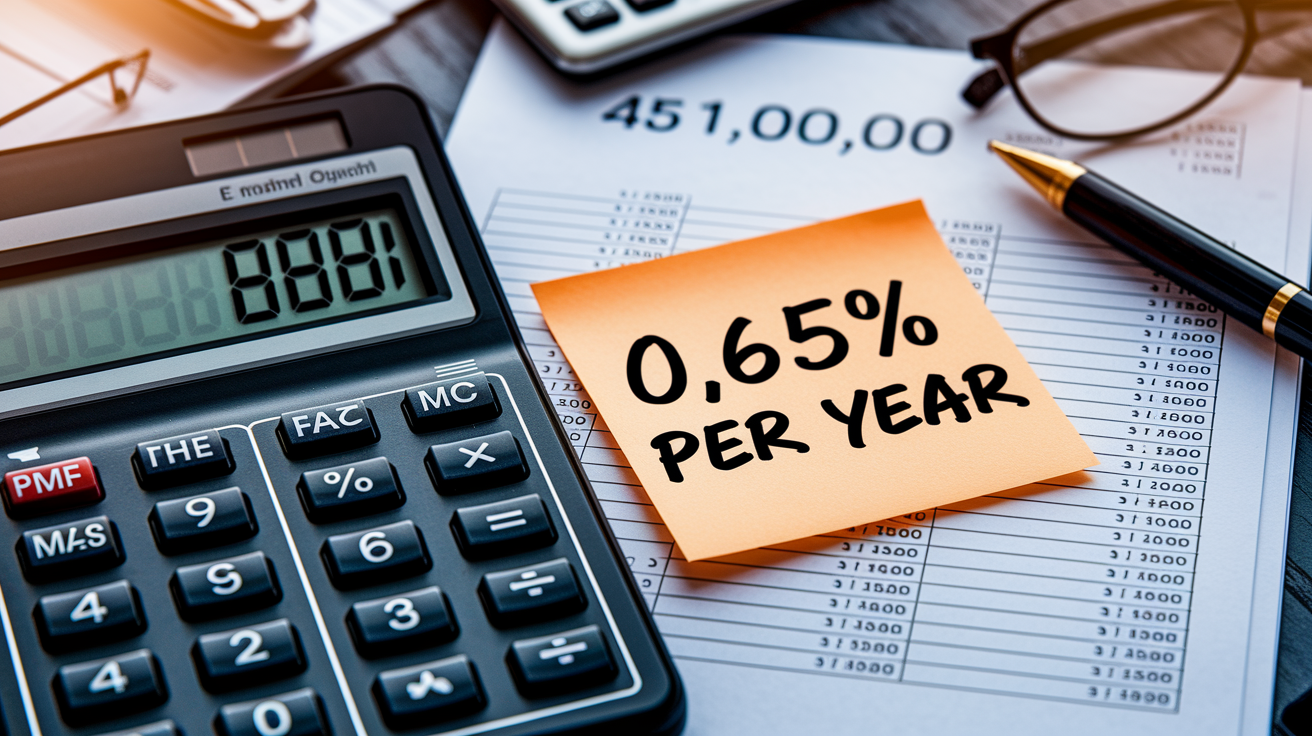
To translate percentages into real costs, multiply the expense ratio by your account balance. If you invest $10,000 in a fund with a 0.65% expense ratio, the annual cost is 0.0065 × $10,000 = $65. That $65 gets deducted incrementally throughout the year, reducing your returns. Same math applies every year, but as your balance grows (or shrinks), the dollar cost changes proportionally.
Front-end loads reduce the amount you invest from the start. The formula is: invested amount = purchase amount × (1 − front-load %). A 5% front-end load on a $50,000 investment means only $47,500 goes to work. The other $2,500 is gone before the first day of compounding. Back-end loads are subtracted from your redemption proceeds. If you sell $10,000 worth of shares and face a 5% CDSC, you receive $9,500. For long-term projections, subtract the expense ratio from your assumed gross annual return to get the net return, then compound that net return over your time horizon. The difference between a low-cost and high-cost fund over 30 years can exceed $10,000 or more on a $10,000 starting balance.
| Calculation | Example Result |
|---|---|
| Annual expense-ratio cost | 0.65% × $10,000 = $65 per year |
| Front-load deduction (5%) | $10,000 purchase − $500 load = $9,500 invested |
| Back-end load deduction (5% CDSC, year 1) | $10,000 redemption − $500 CDSC = $9,500 received |
| Net return = Gross return − ER | 7.0% gross − 0.65% ER = 6.35% net annual return |
Typical Fee Ranges for Different Fund Types and What’s Reasonable

Equity index mutual funds typically charge around 0.05% because they simply track a benchmark and require minimal active management. Actively managed U.S. equity funds average around 0.65% to 0.70% because they pay for research teams, portfolio managers, and higher trading activity. Bond mutual funds average roughly 0.37%, while bond ETFs often come in around 0.11%. See an equity index fund charging 0.75% or an active fund charging 1.50%? Ask what justifies the premium. Most of the time, nothing does.
ETFs generally carry lower expense ratios than mutual funds in the same category. Equity index ETFs average around 0.15%, and actively managed ETFs average around 0.43%. Specialized or sector funds (emerging markets, commodities, small-cap value) can run higher, sometimes 0.45% to over 1.00%, because they require more research or have smaller asset bases that spread fixed costs across fewer dollars. Money market funds and cash products usually charge 0.10% or less.
Use these benchmarks as your reference point. If a large-cap index fund charges more than 0.10%, compare it to alternatives. If an active fund charges more than 0.70%, it needs to consistently beat the market by at least that margin, year after year, just to break even with a cheaper index fund after fees. Higher fees are justified only when the fund delivers unique access, tax advantages, or repeatable outperformance that you can verify in historical, risk-adjusted returns. Otherwise, you’re paying extra for no added value.
Comparing Mutual Funds Fairly Using Fee Data

When you compare two funds, make sure you’re comparing the same type of fund and the same share class. An active large-cap growth fund and a bond index fund have different jobs, different risks, and different average expense ratios. Comparing their fees directly is meaningless. Instead, compare funds within the same Morningstar category or Lipper peer group. Large-cap value to large-cap value. Intermediate-term bond to intermediate-term bond.
Share classes complicate comparisons because the same fund can have five or six different expense ratios depending on the share class. Class A shares might charge 0.70% with a 5% front-end load, while Class I shares charge 0.55% with no load but require a $100,000 minimum. If you qualify for Class I, that’s the fair comparison baseline. Asset-weighted averages also matter: the average expense ratio tells you what most investors pay, not what a tiny fund with few assets charges. Large funds with billions in assets often have lower expense ratios because they spread fixed costs across more money.
Peer and Share-Class Comparison Methods
Match fund types exactly. Compare index to index, active to active, and equity to equity. A 0.50% emerging-market bond fund isn’t expensive if peers average 0.55%. A 0.50% S&P 500 index fund is a ripoff when alternatives charge 0.03%.
Check all share classes before deciding. Use the fund company’s website or Morningstar to see every share class. If you can access institutional or investor shares without a front-end load, that’s often the lowest-cost route.
Evaluate fee-adjusted returns, not just gross returns. A fund that returned 8.0% gross but charged 1.00% delivered 7.0% net. A fund that returned 7.5% gross and charged 0.05% delivered 7.45% net. The second fund wins after fees, even though the first had higher gross performance.
Hidden Mutual Fund Costs Beyond Expense Ratios and Loads

Expense ratios don’t capture every cost. If you hold mutual funds inside a 401(k) or other employer plan, you may also pay administrative fees, sometimes a flat annual charge, sometimes a percentage of assets. Those fees are separate from the fund’s expense ratio and can add 0.10% to 0.50% or more, depending on the plan. Ask your plan administrator for a fee-disclosure document that shows both fund expenses and plan-level fees.
Trading costs and bid-ask spreads mostly affect ETFs and frequent traders, but mutual funds also incur internal transaction costs when the portfolio manager buys and sells securities. Those costs reduce returns but usually don’t appear in the published expense ratio. Redemption fees or short-term trading fees penalize investors who sell within a certain window, commonly 30 to 90 days, and can run 1% to 2% of the redeemed amount. If you’re moving money frequently, these fees add up fast.
Additional hidden costs to check:
401(k) or plan administrative fees. Flat per-account charges or asset-based fees on top of fund expenses.
ETF bid-ask spreads and trading commissions. The difference between the buy and sell price, plus any brokerage commission if your broker still charges one.
Soft-dollar arrangements and wrap fees. Some advisors bundle fund expenses with advisory fees. Make sure you’re not paying twice.
Performance fees or hurdle fees. Rare in mutual funds but common in hedge-fund-style alternatives. The manager takes a cut of returns above a benchmark.
Real Examples of How Mutual Fund Fees Compound Over Time

Start with $10,000, assume a 7.0% gross annual return, and compare three expense ratios over 30 years. A fund charging 0.05% leaves you with a net return of 6.95% per year, growing to roughly $74,900. A fund charging 0.65% nets 6.35% per year and grows to about $63,600. A fund charging 1.00% nets 6.0% and ends at roughly $57,400. The difference between the low-cost and average-cost fund is around $11,300. The difference between low-cost and high-cost is over $17,500, all from fees alone.
Those numbers assume no front-end or back-end loads. Add a 5% front-end load to the high-cost scenario and your starting balance drops to $9,500. After 30 years at 6.0% net, that $9,500 grows to about $54,500. You’ve now lost over $20,000 compared to the low-cost, no-load alternative, and the fund didn’t have to underperform. Fees did all the damage. The math is simple: every percentage point in fees costs you roughly one percentage point of annual compounding, and compounding is where wealth builds.
| Expense Ratio | 30-Year Value (starting $10,000, 7% gross) | Wealth Lost vs 0.05% ER |
|---|---|---|
| 0.05% | $74,900 | $0 (baseline) |
| 0.65% | $63,600 | $11,300 |
| 1.00% | $57,400 | $17,500 |
Choosing Low-Cost Alternatives and Reducing Mutual Fund Fee Drag

Index funds and ETFs that track broad-market benchmarks (S&P 500, total U.S. stock market, total international stock, aggregate bond) routinely charge 0.03% to 0.15%. Many large providers offer funds at 0.03% or 0.04% for core equity indexes. Paying more than that for the same index exposure? You’re leaving money on the table. Switching from a 0.65% active fund to a 0.04% index fund saves $61 per year on every $10,000 invested, and that savings compounds.
Institutional share classes are another way to cut costs if you qualify. Class I or institutional shares often charge 10 to 20 basis points less than retail Class A or C shares. You usually need a $100,000 minimum or access through an employer retirement plan, but the savings are permanent. If your 401(k) offers both retail and institutional share classes of the same fund, always choose institutional. The expense-ratio difference may look small (0.55% vs 0.70%), but over 20 or 30 years, that 0.15% gap costs thousands.
When two funds track the same index, pick the one with the lower expense ratio every time. Tracking error and portfolio composition will be nearly identical, so fees are the only variable that matters. Avoid funds with high 12b-1 fees unless you’re getting ongoing advice that justifies the cost. Most of the time, you’re not. Check your fund’s asset size: funds with less than $50 million in assets often have higher expense ratios because fixed costs spread across fewer dollars, and small funds sometimes merge or close, forcing you to move your money again.
Three quick tactics to minimize fee drag:
Use broad-market index funds or ETFs for core holdings. Expect expense ratios of 0.03% to 0.15% and skip actively managed alternatives unless there’s a proven, repeatable edge.
Access institutional share classes when available. If your 401(k), IRA custodian, or brokerage offers Class I shares and you meet the minimum, take them. The 10 to 20 basis-point savings compounds to real money.
Avoid front-end and back-end loads entirely. No-load funds and ETFs deliver identical market exposure without the up-front or exit penalty. If an advisor insists on load funds, ask for a fee-only advisor who uses no-load alternatives instead.
Final Words
Cut fees first: find the expense ratio, spot any load, and run the dollar math. That’s the core action that changes long-term returns.
This guide broke down expense-ratio components, front- and back-end loads, where to read the prospectus, how to calculate dollar drag, and how to compare funds and share classes.
If you follow these steps on how to analyze mutual fund expense ratios and load fees, you’ll avoid costly choices and keep more of your gains over time. Small percentage differences matter—so act on them.
FAQ
Q: What is an expense ratio?
A: The expense ratio is the annual cost a fund charges, shown as a percent of assets. For example, 1% equals $10 per $1,000 invested per year.
Q: How do load fees work?
A: Load fees are sales charges: a front-end load reduces the money invested immediately, while a back-end (CDSC) charges you if you redeem early; a 5% front-end on $10,000 leaves $9,500 invested.
Q: How do I calculate the dollar impact of an expense ratio?
A: To calculate the dollar impact, multiply the expense ratio by your investment value. Example: 0.65% × $10,000 = $65 annual cost taken from returns.
Q: Where can I find expense ratio and load information?
A: You can find expense ratios and load details in the fund prospectus “Fees and Expenses” table, on the fund fact sheet, the Statement of Additional Information, or SEC EDGAR filings.
Q: What are typical expense ratio ranges for different fund types?
A: Typical ranges: equity index funds about 0.05%, actively managed equity around 0.65%, bond funds about 0.37%, and ETFs roughly 0.11–0.43%.
Q: What are 12b-1 fees and how do they affect returns?
A: 12b-1 fees are annual distribution/marketing charges, often 0.25%–1.00%, that sit inside the expense ratio and reduce your returns every year.
Q: How do I compare mutual funds fairly using fee data?
A: To compare fairly, match fund category and time period, compare the same share class, convert fees into dollar drag, and evaluate net-of-fee returns.
Q: What hidden costs beyond expense ratios and loads should I watch for?
A: Hidden costs include trading costs from turnover, bid-ask spreads, short-term redemption fees, 401(k) admin charges, and soft-dollar or performance-related costs.
Q: How much can fees cost over decades?
A: Fees compound: $10,000 at 7% for 30 years yields about $74,900 with 0.05% ER but roughly $63,600 with 0.65% ER — about $11,300 less.
Q: How can I reduce mutual fund fee drag?
A: You reduce fee drag by choosing index funds or ETFs (often 0.03%–0.15% ER), using institutional share classes to save 10–20 bps, and avoiding loads and high 12b-1 fees.
Q: When are higher mutual fund fees justified?
A: Higher fees can be justified when a manager consistently delivers net-of-fee outperformance, provides unique exposures, or lowers volatility — verify with a long-term, after-fee track record.
