
Think all robo-advisors are the same? Think again.
Marketing makes them look identical, but fees, tax tools, and portfolio logic change your returns.
This post gives a simple, referee-style checklist so you can compare apples to apples.
You’ll learn the six things that matter—total fees, portfolio construction, tax-loss harvesting, customization, account minimums, and platform usability—and how to score and weight each one.
Do the math once. Pick the robo-advisor that actually saves or grows your money.
Core Method for Evaluating Robo-Advisors

When you’re comparing robo-advisors, you need a standardized approach that makes side-by-side evaluation actually fair. Start with the facts that matter most: total cost, investment philosophy, and how much control you keep. Without a consistent method, you’ll end up choosing based on marketing instead of real value.
Gather identical data for each platform. If one provider shares net-of-fees returns while another buries expense ratios, that’s a signal in itself. You’re trying to compare apples to apples: what you pay, what you get, and what you can verify. Each robo-advisor should answer the same questions. If one can’t or won’t, move on.
Your comparison framework needs these six pillars:
- Total fees and cost structure (not just the advisory fee, but fund expense ratios, trading costs, account fees, anything hidden)
- Investment strategy and portfolio construction (how the platform allocates assets, which optimization method it uses, whether the approach fits your risk tolerance)
- Tax-loss harvesting and tax efficiency (whether automated tax strategies are included, at what balance they kick in, how often they run)
- Customization and personalization options (ability to modify allocations, select ESG funds, or integrate external holdings)
- Account minimums and accessibility (the dollar threshold to open an account and whether premium features require larger balances)
- Platform usability and customer support (ease of onboarding, dashboard clarity, access to human advisors, responsiveness of help channels)
Treat these as a checklist. Collect the same data from at least three finalists, score each on a 0 to 10 scale, then weight the scores based on what you care about most.
Understanding Fee Structures and Cost Transparency
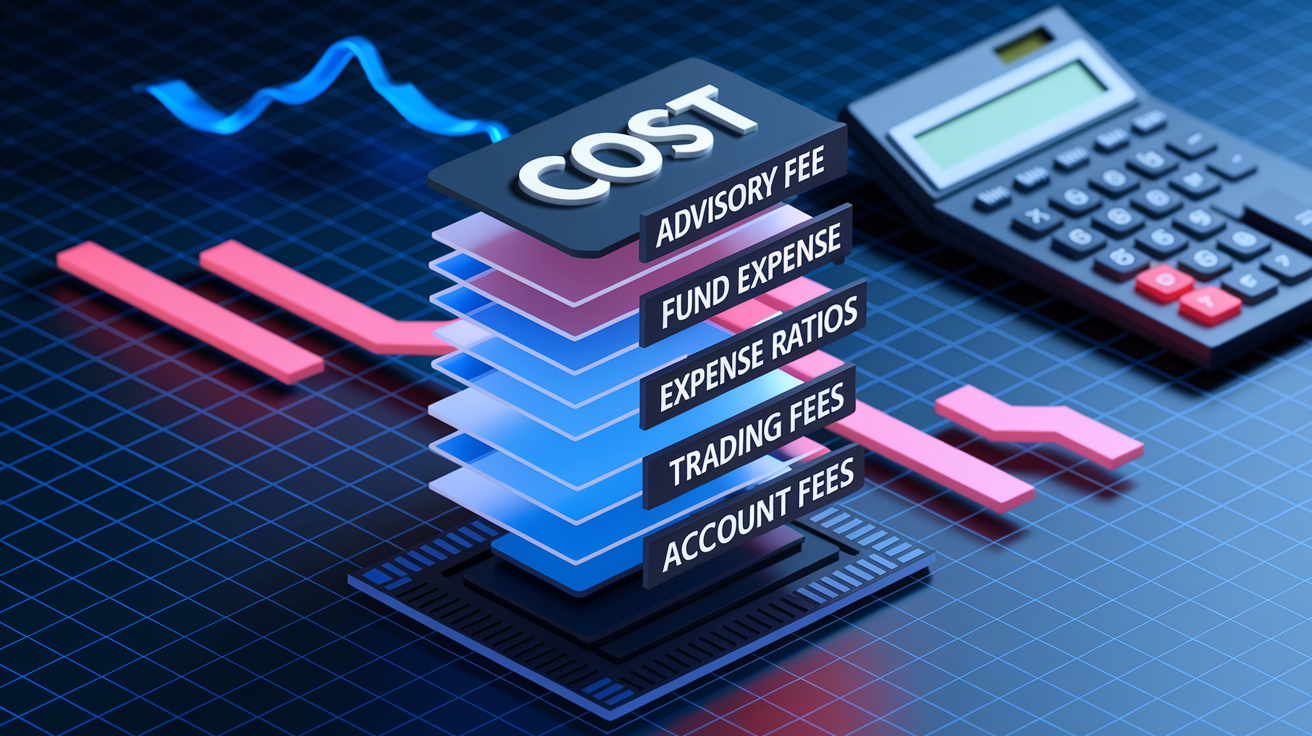
Robo-advisor fees sound simple at first. A percentage of your balance charged annually. But the real cost has multiple layers, and platforms don’t always present them clearly. A 0.25 percent management fee looks low until you discover the underlying ETFs carry another 0.15 percent, bringing your total to 0.40 percent. That extra 0.15 percent on a $100,000 portfolio costs you $150 every year you didn’t expect to pay.
Always calculate the all-in cost by adding the advisory fee to the weighted average expense ratio of the funds in your portfolio. Some platforms charge monthly subscription fees instead of percentage-based fees. A $5 monthly fee equals $60 per year, which is less than 0.25 percent on a $30,000 account but more expensive than a 0.25 percent fee on a $10,000 account. Run the math for your actual balance.
When comparing costs, collect these four categories for every platform:
Advisory or management fee (the percentage charged by the robo-advisor itself, typically 0.00 to 0.50 percent annually)
Underlying fund expense ratios (the weighted average cost of the ETFs or mutual funds in your portfolio, usually 0.02 to 0.30 percent)
Trading and transaction fees (commissions per trade or rebalancing event, though most platforms now use commission-free ETFs, so this should be zero)
Account and service fees (custody fees, transfer fees, or fees for human advisor access, which can range from zero to hundreds of dollars per year)
Portfolio Strategy and Asset Allocation Methods

Robo-advisors build portfolios using algorithms, but the logic behind those algorithms varies a lot. Most platforms use a version of modern portfolio theory, which tries to maximize expected return for a given level of risk by diversifying across asset classes. The differences show up in how they measure risk, how many asset classes they include, and how often they rebalance.
Some platforms use mean-variance optimization, which calculates the ideal mix of stocks and bonds based on historical volatility and correlation. Others use proprietary methods with names like Diversification Optimization, which may weight assets differently to avoid concentration risk. Ask each platform to describe its optimization engine in plain language. If the explanation sounds vague or the methodology isn’t documented, that’s a warning.
The core portfolio typically includes domestic stocks, international stocks, bonds, and sometimes real estate or commodities. A moderate-risk portfolio might allocate 60 percent to stocks and 40 percent to bonds, but one platform might hold 10 percent in international stocks while another holds 30 percent. Those allocation differences directly affect performance, especially when international markets lag or outperform U.S. markets.
Risk Assessment
Most robo-advisors start with a questionnaire to determine your risk tolerance and time horizon. The questions usually cover your age, income, investment goals, and how you’d react to a market drop. The platform then assigns you a risk score and maps that score to one of several model portfolios.
Compare how many model portfolios each platform offers. A platform with only three models (conservative, moderate, aggressive) gives you less precision than one with ten or fifteen risk bands. If your true risk tolerance falls between two models, you may end up with a portfolio that’s too cautious or too aggressive.
Rebalancing Automation
Rebalancing keeps your portfolio aligned with your target allocation as markets move. Some platforms rebalance on a fixed schedule, like quarterly. Others use threshold-based rebalancing, which triggers a trade only when an asset class drifts by a certain percentage, typically 1 to 5 percent.
Threshold-based rebalancing tends to be more tax efficient because it avoids unnecessary trades. Ask each platform how often it rebalances and whether you can adjust the threshold. Frequent rebalancing in a taxable account can generate more taxable events, so the method matters.
Evaluating Tax Optimization Features

Tax-loss harvesting automatically sells investments that have lost value, books the loss to offset other gains, and immediately buys a similar but not identical investment to maintain your allocation. This can save you hundreds or thousands of dollars per year in taxes, depending on your income and account size. Not all platforms offer it, and those that do often restrict it to accounts above a certain minimum, commonly $50,000 or higher.
When comparing tax features, check whether the platform runs tax-loss harvesting daily, monthly, or only at year-end. Daily harvesting captures more opportunities, especially in volatile markets. Also confirm how the platform handles wash-sale rules, which disallow a loss if you buy a substantially identical security within 30 days. A good system will avoid wash sales across all your accounts, not just the robo-advisor account.
Key tax tools to compare:
Automated tax-loss harvesting (availability, account minimum, and frequency like daily vs quarterly)
Tax-lot optimization (whether the platform selects specific shares to sell in order to minimize taxes, using specific identification vs average cost)
Wash-sale tracking and avoidance (cross-account monitoring to prevent accidental wash sales in linked accounts)
Personalization, Goal Tracking, and User Customization

Robo-advisors range from rigid preset portfolios to highly flexible platforms that let you adjust allocations, exclude certain sectors, or add ESG and socially responsible funds. If you want to avoid tobacco or fossil fuels, check whether the platform offers values-based screening. If you already own individual stocks in another account, confirm whether the platform can coordinate with those holdings to avoid overlap or manage overall risk.
Goal-based investing tools allow you to set specific targets, like saving for a house down payment in five years or building a retirement fund over thirty years. The platform then adjusts your asset allocation and risk level to match each goal’s time horizon. Some platforms create separate virtual portfolios for each goal, making it easier to track progress. Others use a single blended portfolio, which is simpler but less precise.
Customization becomes especially important as your account grows. A $10,000 portfolio benefits less from fine-tuning than a $500,000 portfolio. Platforms that offer direct indexing (which holds individual stocks instead of ETFs to allow more granular tax-loss harvesting) typically require minimums of $100,000 or more. If you expect your balance to grow, choose a platform that can scale with you rather than forcing you to switch providers later.
Platform Usability and Customer Support Evaluation

A robo-advisor’s interface should be fast, clear, and organized. Onboarding time matters because a confusing sign-up process often signals poor design throughout the platform. Measure how long it takes to open an account, answer the risk questionnaire, and see your first recommended portfolio. Ten minutes is reasonable. Thirty minutes with unclear instructions isn’t.
Mobile app quality and dashboard clarity are daily-use factors. Check whether you can view your full portfolio, transaction history, tax documents, and performance reports from your phone. Look for real-time balance updates, clean visualizations of asset allocation, and easy access to customer support within the app. Platforms that require you to log in on a desktop to perform basic tasks or download reports add unnecessary friction.
| Feature | Why It Matters |
|---|---|
| Onboarding time under 15 minutes | Indicates clear workflows and reduces abandonment risk during setup. |
| Mobile app with full account access | Allows real-time monitoring, deposits, and support requests on the go. |
| Human advisor availability (phone, chat, email) | Provides guidance during market volatility or complex account questions. |
| Transparent performance and fee reporting | Enables you to verify net-of-fees returns and understand total costs clearly. |
Criteria Weighting and Decision Framework
Not every criterion carries the same weight for every investor. If you’re cost-sensitive and plan to hold the account for decades, fees might deserve 40 percent of your decision weight. If you value human advice and need help with complex financial planning, customer support and advisor access might deserve 30 percent. Build a simple weighting system to match your priorities.
Start by listing your top three priorities. Then assign a percentage to each of the six comparison pillars so the total equals 100 percent. A cost-focused investor might weight fees 40 percent, tax features 20 percent, investment strategy 15 percent, minimums 10 percent, customization 10 percent, and usability 5 percent. A hands-off investor who values simplicity might weight customer support 30 percent, usability 25 percent, fees 20 percent, strategy 15 percent, and tax features 10 percent.
After weighting, score each platform on a 0 to 10 scale for each pillar. Multiply each score by its weight, then sum the weighted scores to get a total score out of 10 for each platform. If a platform scores 8 on fees (weight 40 percent), 6 on tax features (weight 20 percent), and 7 on strategy (weight 15 percent), the weighted total so far is 8 × 0.40 + 6 × 0.20 + 7 × 0.15, which equals 3.2 + 1.2 + 1.05, or 5.45 out of a possible 10.
Follow these three steps to create your weighting system:
- Rank the six pillars (fees, strategy, tax features, customization, minimums, usability and support) from most to least important for your situation.
- Assign percentage weights that reflect your ranking and total 100 percent.
- Score each candidate platform 0 to 10 on each pillar, multiply by the weight, and sum to a final score. Platforms scoring 7 or higher are strong candidates. 4 to 7 are acceptable. Below 4 should be eliminated.
Common Red Flags and How to Spot Them

Some warning signs indicate a robo-advisor may not deliver what it promises or may cost you more than expected. High headline fees above 0.50 percent for basic service should trigger scrutiny, especially if the platform doesn’t offer advanced features like direct indexing or dedicated financial planners. Platforms that hide underlying fund expense ratios or refuse to provide total cost breakdowns are also suspect.
Lack of transparency around investment strategy is another red flag. If the platform can’t or won’t explain its optimization method, rebalancing rules, or portfolio construction logic in clear terms, you have no way to verify whether the approach is sound. Vague marketing language about proprietary algorithms without methodology documentation or performance backtests should make you pause.
Watch for these five red flags:
Opaque or layered fee structures (missing details on fund expense ratios, trading costs, or account fees beyond the headline advisory fee)
No published performance data (absence of net-of-fees historical returns for one-year, three-year, and five-year periods)
Undocumented investment methodology (refusal to share details on optimization engine, rebalancing rules, or risk-scoring approach)
Poor or unavailable customer support (long wait times, no human advisor access, or unresponsive help channels during market volatility)
Lack of regulatory disclosures (missing ADV brochure, unclear SEC or state registration, or evasive answers about custody and SIPC coverage)
Final Words
We cut straight to the core: compare fees, portfolio strategy, tax tools, personalization, usability, and weight criteria to match your goals.
Use the six-pillar checklist and a simple weighting system to score options. Run numbers on fees and tax features. Test the app and support before you move money.
If you need a quick decision, follow the steps here to see how to compare robo-advisors and pick the one that fits your goals. You’ll have a clearer, safer choice.
FAQ
Q: What is the core method for evaluating robo-advisors?
A: The core method for evaluating robo-advisors is to compare fees, investment strategy, rebalancing, tax optimization, personalization level, and customer support—those six pillars show long-term costs, performance drivers, and user fit.
Q: How do robo-advisor fees affect my returns?
A: Robo-advisor fees affect returns because management fees (often 0.15–0.40% yearly) plus ETF expense ratios reduce compounded growth; a 0.25% fee on $100,000 costs about $250 per year.
Q: How do robo-advisors build and allocate portfolios?
A: Robo-advisors build portfolios using modern portfolio theory, diversified ETF mixes, automatic risk scoring, and algorithmic optimization to match your risk profile and rebalance to maintain target allocations.
Q: What tax optimization features should I look for?
A: Tax optimization features include automated tax-loss harvesting, wash‑sale avoidance, and optimized lot selection; these tools can lower taxes but are often limited to higher-tier accounts.
Q: How much can I personalize my portfolio?
A: Personalization ranges from fixed model portfolios to fully customizable allocations, goal-based tracking, and ESG filters; more customization can improve fit but may raise complexity or require higher pricing tiers.
Q: How should I judge platform usability and customer support?
A: Judge platform usability by dashboard clarity, mobile app quality, simple onboarding, and access to human advisors; fast response times and clear fee displays matter for everyday use and trust.
Q: How do I weight evaluation criteria to choose the right robo-advisor?
A: To weight evaluation criteria, list your priorities, assign 1–10 importance scores, then rate each platform and multiply scores to rank options—repeat until your top choice matches your goals.
Q: What are common red flags when comparing robo-advisors?
A: Common red flags are high or hidden fees, vague investment strategy, poor transparency, limited customer support, and unstable platform performance—these raise cost, risk, or service problems over time.
